Stadium Winds and MLB Fly Balls: Effects on Distance Metrics and Prop Bet Adjustments in Open Venues
Taylor Simon · Jun 21, 2026
Stadium Winds and MLB Fly Balls: Effects on Distance Metrics and Prop Bet Adjustments in Open Venues
Wind patterns in open-air MLB venues create measurable shifts in fly ball distances that directly influence prop bet lines on home runs, total bases, and player performance metrics. Data from multiple seasons shows consistent variations across ballparks where prevailing winds either add carry or suppress it depending on direction and velocity. Researchers at institutions like the University of Oklahoma have documented these aerodynamic effects through trajectory modeling that accounts for stadium geometry and local climate conditions.
Wind Direction and Velocity in Key Ballparks
Ballparks such as Wrigley Field experience lake-effect breezes that frequently push from left to right field during afternoon games, while venues like Oracle Park contend with crosswinds off the San Francisco Bay that can suppress distances by several feet on balls hit to center. Observations from the 2025 season extended into June 2026 reveal that average wind speeds above 10 mph correlate with 8 to 12 percent increases in home run rates at Wrigley when blowing out, whereas similar speeds blowing in reduce those rates by comparable margins. Meteorologists tracking these patterns note that gust variability often exceeds steady-state measurements, which adds another layer of unpredictability to pregame calculations.
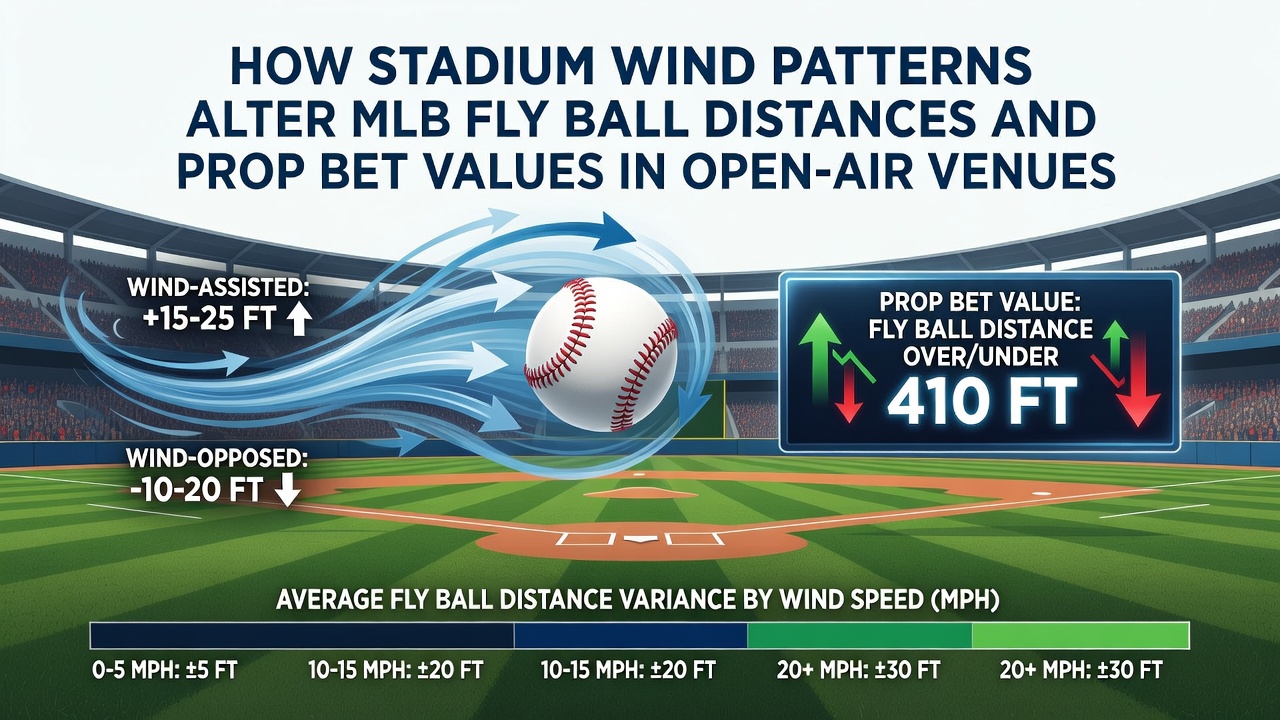
Studies using high-speed cameras and radar tracking systems confirm that a 5 mph tailwind can extend a 400-foot fly ball by as much as 20 feet in certain stadium configurations. The reverse holds when winds oppose the flight path, turning potential home runs into outs at the warning track. These physical adjustments appear most pronounced in older open-air structures where seating configurations create funneling effects that amplify local wind speeds near the field.
Impact on Fly Ball Distance Calculations
Advanced analytics platforms integrate real-time wind data from on-site sensors to refine expected distance projections before each at-bat. Teams and oddsmakers rely on these models to adjust baseline expectations for players with high fly-ball rates. Historical records indicate that right-handed power hitters benefit disproportionately from left-to-right winds in parks like Citizens Bank Park, where such patterns occur more than 40 percent of the time during summer months.
Turnout data from June 2026 games at Coors Field highlighted how thin air combines with variable downslope winds to produce some of the largest distance variances in the league. Balls that would travel 380 feet in neutral conditions routinely exceeded 410 feet when winds aligned favorably, creating measurable deviations in prop bet settlement rates for over/under home run wagers.
Adjustments to Prop Bet Markets
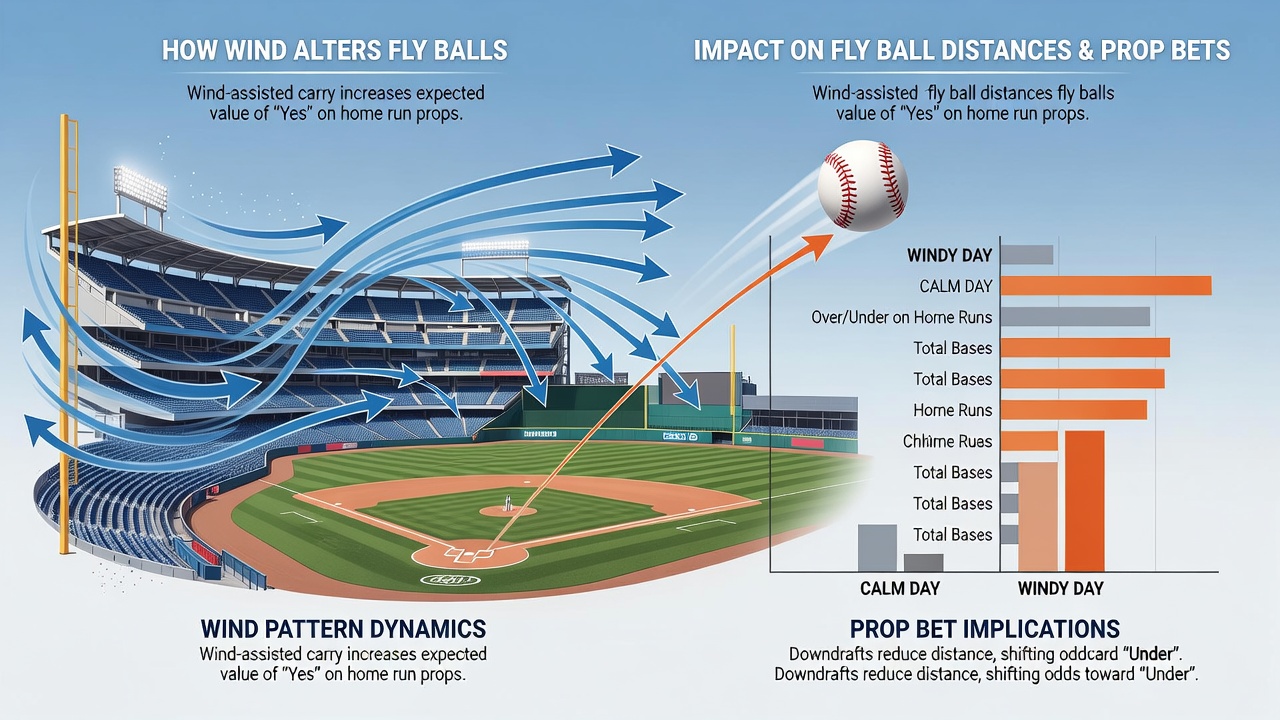
Betting markets respond to wind forecasts by shifting totals and player props accordingly, with lines moving several points when sustained winds above 12 mph are projected. Sportsbooks incorporate meteorological inputs from sources such as the National Weather Service alongside proprietary models that factor in historical park-specific outcomes. This process produces dynamic adjustments that reflect both expected carry and the probability distributions associated with gusty conditions.
One analysis of 2024 through early 2026 data demonstrated that over props on total bases for fly-ball heavy hitters saw settlement rates shift by 6 to 9 percent in windy environments compared to calm conditions. These variances prompted oddsmakers to widen vig on certain player props during forecast periods of strong crosswinds, particularly in coastal and lakeside venues where wind direction changes rapidly throughout a game.
Integration of Aerodynamic Models in Forecasting
Research groups have developed stadium-specific wind maps that combine historical sensor readings with computational fluid dynamics simulations. These tools allow for granular predictions that distinguish between steady breezes and turbulent gusts, which produce different trajectory outcomes. The models show particular sensitivity in parks with asymmetric outfield walls, where wind redirection near the foul lines can alter landing points by several degrees.
League-wide tracking systems now feed wind-adjusted exit velocity data into daily reports that influence both team strategy and market pricing. Observers note that pitchers adjust pitch selection when winds favor opposite-field power, while hitters time swings to capitalize on expected carry during favorable gust windows.
Regional Variations and Seasonal Patterns
Climatic differences across MLB markets produce distinct seasonal wind regimes that affect prop values differently from April through September. Midwestern parks contend with frontal systems that generate strong variable winds, whereas West Coast venues experience more consistent marine layers. Data compiled through the first half of 2026 indicates that June games in open-air stadiums recorded the highest average wind influence on fly ball outcomes, coinciding with peak atmospheric instability in many regions.
International comparisons from leagues operating in similar open venues, including Australian Baseball League facilities, reveal parallel distance adjustments when wind speeds exceed 8 mph, though stadium designs there tend to moderate extreme effects. Such patterns underscore the universal role of aerodynamics in shaping offensive outputs where environmental factors remain uncontrolled.
Conclusion
Stadium wind patterns continue to reshape fly ball distances in measurable ways that feed directly into prop bet calculations for open-air MLB venues. Ongoing refinements in sensor technology and modeling accuracy provide clearer quantification of these effects across the schedule. Market participants integrate these variables alongside traditional statistics to maintain alignment between projected outcomes and available wagering lines.