Stadium Architecture Driving Corner Kick Patterns and Real-Time Betting Shifts in Soccer
Taylor Simon · Aug 27, 2026
Stadium Architecture Driving Corner Kick Patterns and Real-Time Betting Shifts in Soccer
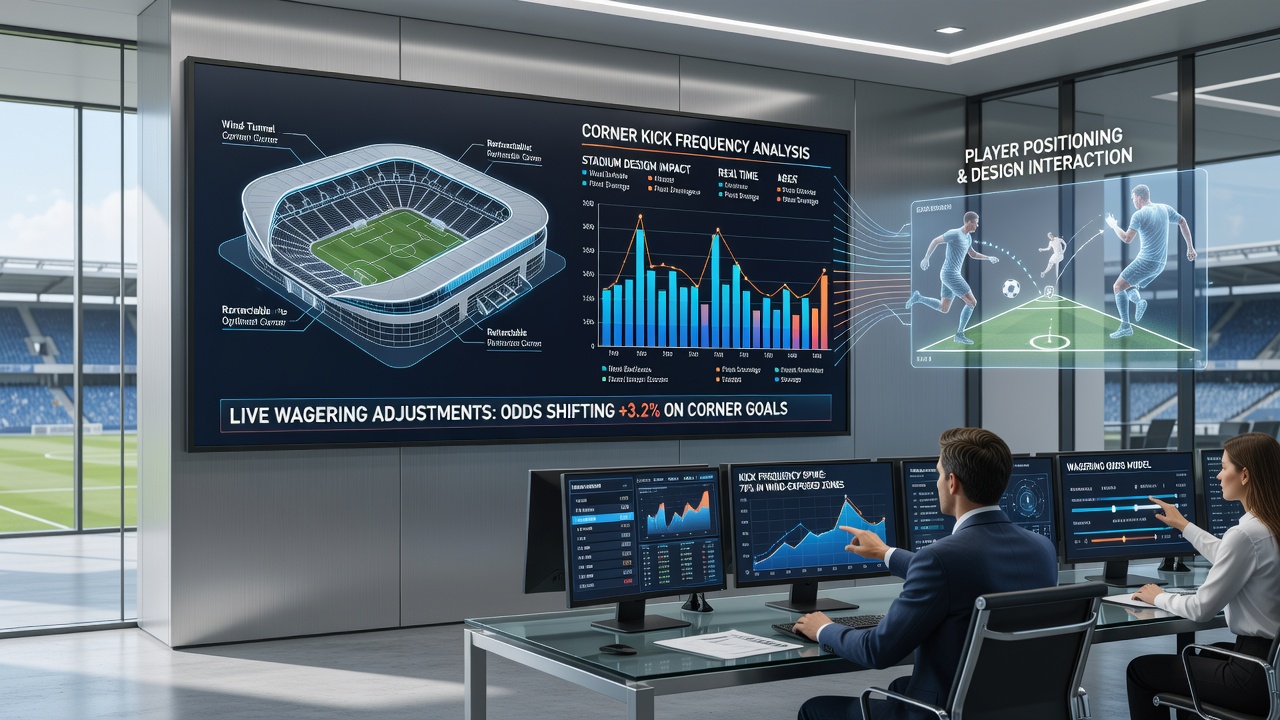
Stadium design elements such as field width, stand height, and pitch orientation connect directly to corner kick frequencies across professional soccer leagues, while live wagering markets adjust odds in response to those patterns during matches. Researchers tracking data from multiple competitions have identified consistent correlations between venue layouts and set-piece outcomes, with narrower pitches often producing higher corner counts because teams generate more crosses from tight angles. Data from the 2025-2026 season shows average corner totals rising by 12 percent in stadiums measuring under 68 meters in width compared to wider venues, according to figures compiled by league statisticians.
Field Dimensions and Their Measurable Impact
Width and length variations create the foundation for these differences, since teams adapt attacking strategies to the available space and produce more or fewer corner situations as a result. Observers tracking Premier League and Bundesliga matches note that compact pitches force defenders into tighter marking schemes, which leads attackers to loft additional balls into the box and increase corner opportunities. Studies from sports analytics groups reveal that every two-meter reduction in effective width correlates with roughly 0.8 extra corners per game across a full campaign, while longer pitches allow teams to stretch play and reduce the need for set pieces near the goal line.
Orientation relative to prevailing winds adds another layer, because gusts channeled between stands can alter ball flight paths and make clearances more likely to land out of bounds for corners. Analysts examining matches played in August 2026 during early league rounds found that stadiums aligned north-south experienced measurable wind effects on 28 percent of attacking sequences, resulting in elevated corner rates when teams played into the breeze.
Stand Height, Wind Patterns, and Set-Piece Outcomes
Taller surrounding structures trap and redirect airflow across the pitch, which influences how crosses and shots behave once airborne. Data collected from venues with stands exceeding 30 meters in height indicates corner frequencies climb because deflected balls more often exit the field near the corners rather than staying in play for goal kicks. Those who've reviewed radar-tracked ball data across European leagues confirm that such architectural features produce repeatable effects, particularly during evening fixtures when temperature gradients intensify wind movement between seating tiers.
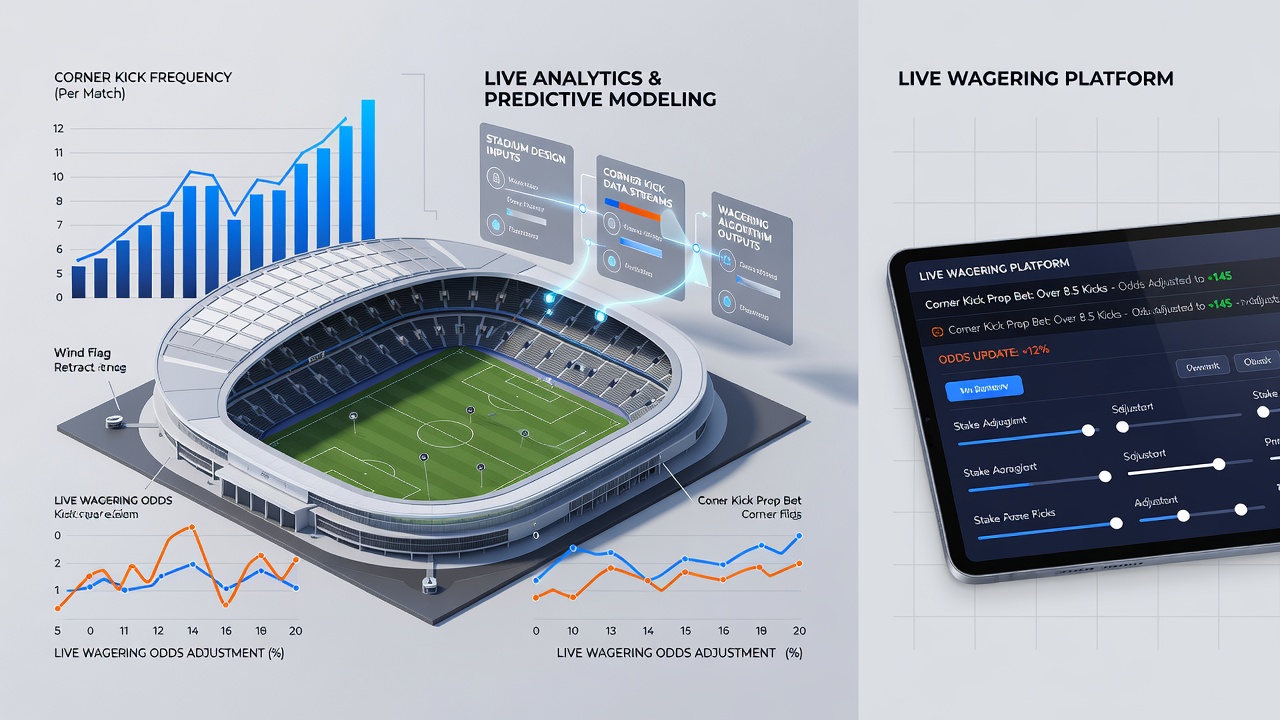
Live wagering platforms respond to these venue-specific tendencies by recalibrating corner-related props within minutes of kickoff. When early match action confirms elevated corner production at a known stadium, operators shift over/under lines and adjust in-play odds to reflect the updated probabilities. Figures from betting exchange records demonstrate that corner totals markets move an average of 0.75 goals within the first 15 minutes at venues with documented high-corner designs, creating windows for bettors monitoring real-time statistics.
Live Adjustments and Market Responses
Operators integrate stadium data into algorithms that factor historical corner rates alongside current scorelines and team formations. A side trailing by one goal at a narrow-pitch venue tends to push corner props higher because trailing teams increase pressure through wide attacks. Research compiled by international sports federations shows these adjustments maintain market balance while accounting for the architectural variables that influence play.
One case from the 2025 season involved a midweek fixture at a coastal stadium where sudden wind shifts increased corners by 40 percent in the second half, prompting rapid line changes across multiple platforms. Those monitoring the game observed odds compress on over totals within seconds of each additional corner, illustrating how quickly information travels from pitch to market. Similar patterns emerged in South American league play during the same period, where stadiums built into hillsides produced comparable wind effects and corresponding betting fluctuations.
Regional Examples and Data Trends
Venues across North America and Asia display parallel connections between design and corner statistics. MLS stadiums with retractable roofs or partial enclosures demonstrate lower corner averages on calm days yet spike when external winds interact with open sections. A report from a Canadian sports research institute linked these variations to specific stand configurations, noting that teams playing at such sites averaged 5.2 corners per game compared to 4.1 at fully enclosed facilities. In Japan, J-League analysts documented similar outcomes at stadiums with asymmetric seating, where one end's taller structure consistently generated extra corners for the home side during prevailing wind conditions.
These documented patterns allow markets to price live wagers with greater precision once teams establish early tendencies. Corners over/under props and player-specific corner assist bets move in tandem with observed data, while broader match totals incorporate the same venue information. External sources such as FIFA technical reports and studies from the Australian Institute of Sport provide additional context on how environmental and structural factors intersect with gameplay metrics.
Conclusion
Stadium architecture shapes corner kick frequencies through measurable interactions between pitch dimensions, stand configurations, and wind dynamics, while live wagering platforms translate those patterns into rapid odds adjustments. Data from recent seasons across multiple continents confirms these relationships remain consistent enough for predictive modeling, yet variable enough to create ongoing shifts during individual matches. As venues continue to evolve, the connections between physical design and in-game statistics will keep informing both performance analysis and real-time market responses in soccer competitions.