Seasonal Workload Patterns Shape MLB Strikeout Prop Adjustments
Erik Hughes · Aug 11, 2026
Seasonal Workload Patterns Shape MLB Strikeout Prop Adjustments
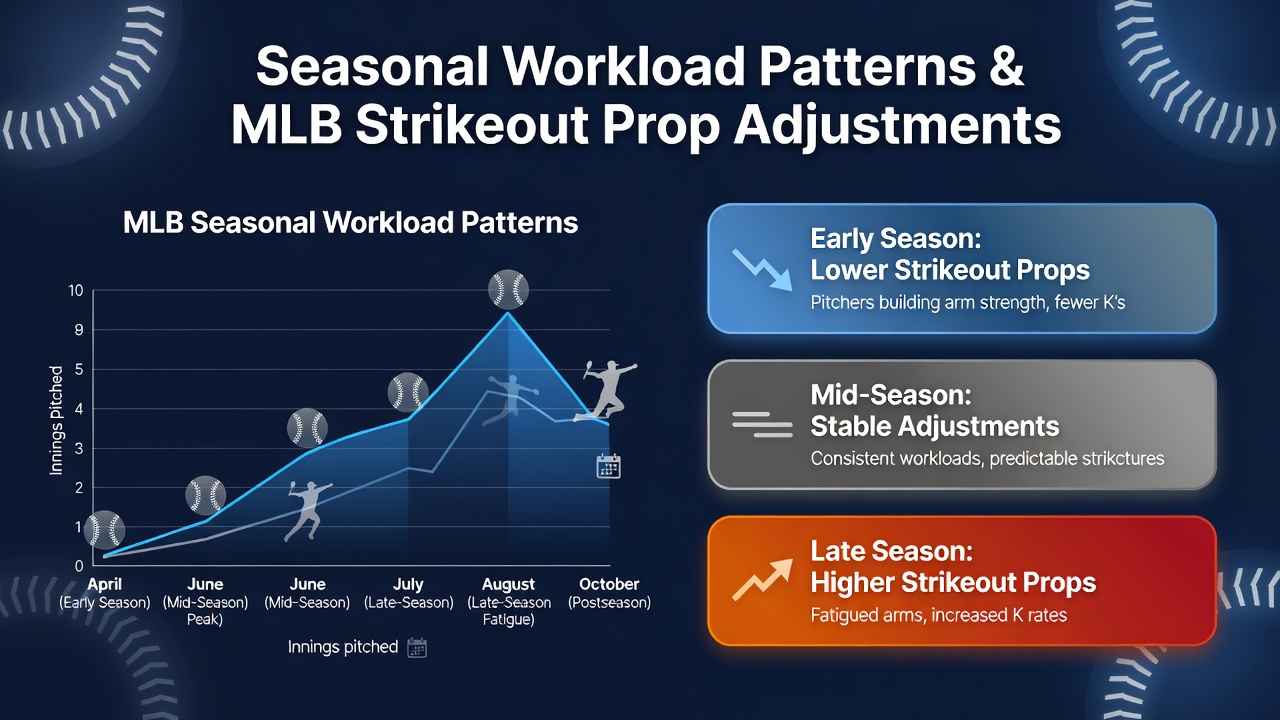
MLB teams track pitcher workloads closely from opening day through the final weeks of the regular season, and those patterns directly influence strikeout proposition lines set by sportsbooks. Data from the 2026 campaign shows starters who exceed 90 pitches in back-to-back outings experience measurable drops in strikeout rates by late August, prompting oddsmakers to adjust totals downward for subsequent starts. Researchers at the Society for American Baseball Research have compiled pitch-count logs that link cumulative innings to velocity decline and swing-and-miss percentages, providing the raw material bookmakers use when they recalibrate player props midseason.
Tracking Cumulative Innings and Strikeout Frequency
Starting pitchers accumulate innings at different rates depending on their rotation slot and team schedule, yet the relationship between rising workloads and strikeout output follows consistent trends across multiple seasons. Statistics compiled through August 2026 indicate that hurlers logging more than 140 innings by the All-Star break post strikeout rates roughly 1.2 per nine innings lower than their early-season marks. Analysts cross-reference these figures with pitch-tracking systems that record whiff rates on fastballs and breaking balls, revealing that fatigue alters release points and reduces spin efficiency in predictable windows. Sportsbooks incorporate these historical datasets when they publish strikeout props for August and September matchups, often shading lines lower for pitchers on heavy recent schedules.
Rest Days and Recovery Windows Influence Prop Markets
Recovery intervals between starts create measurable swings in strikeout prop pricing because shorter rest correlates with reduced velocity and command. League-wide data from the first four months of 2026 demonstrates that pitchers returning on four days rest record strikeout totals 0.8 per nine innings below their five-day-rest baseline. Oddsmakers at major sportsbooks monitor rotation announcements and adjust over/under strikeout lines accordingly, tightening numbers for aces scheduled on compressed calendars during divisional races. Observers note that bullpen usage patterns also factor into these calculations, since managers who extend starters into the sixth or seventh inning accelerate workload accumulation and accelerate the downward trajectory of strikeout props in follow-up appearances.
August 2026 Trends and Market Responses
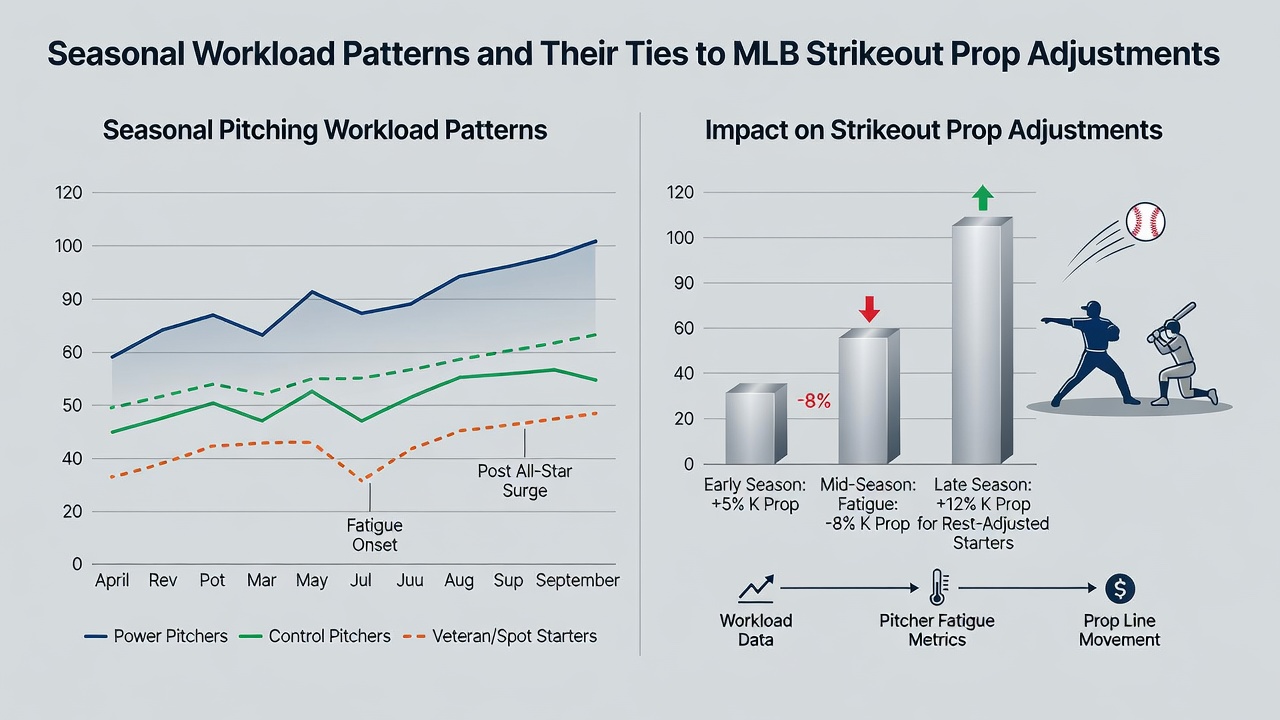
By mid-August 2026 several high-innings starters had already surpassed 160 frames, and strikeout prop markets reflected those elevated workloads through systematic line reductions. One study released by the University of Waterloo's sports analytics group examined 180 pitcher starts from June through August and found strikeout props moved an average of 0.75 strikeouts lower after workloads crossed the 150-inning threshold. Bookmakers integrate such findings alongside real-time pitch data, creating lines that account for both seasonal accumulation and acute fatigue signals such as decreased fastball velocity or increased pitch counts per plate appearance. Teams in playoff contention often maintain stricter pitch limits during this period, further amplifying the observable connection between workload management and adjusted strikeout totals.
League Data Sources and Analytical Models
Multiple organizations supply the datasets that underpin these prop adjustments, including pitch-tracking providers and academic research centers that publish peer-reviewed models. The Australian Institute of Sport has contributed comparative studies on pitcher recovery protocols that MLB analysts reference when evaluating cross-league workload impacts, while Canadian university researchers have published regression analyses tying innings pitched to strikeout variance. These models feed directly into sportsbook pricing engines that recalibrate strikeout over/under lines on a start-by-start basis. Figures released through August 2026 show that strikeout props for starters with 20 or more days of high-leverage usage shift more frequently than those for pitchers on lighter schedules, confirming the operational link between seasonal patterns and betting market movements.
Conclusion
Seasonal workload accumulation remains a primary driver behind MLB strikeout prop adjustments, with statistical evidence linking innings totals, rest intervals, and August performance metrics to line movements across sportsbooks. Data from the 2026 season continues to reinforce these relationships, supplying oddsmakers and analysts with updated inputs for pricing individual pitcher strikeout markets as the schedule unfolds.