Schedule Density's Influence on MLB Batting Trends and Run Line Markets
Erik Hughes · Jun 14, 2026
Schedule Density's Influence on MLB Batting Trends and Run Line Markets
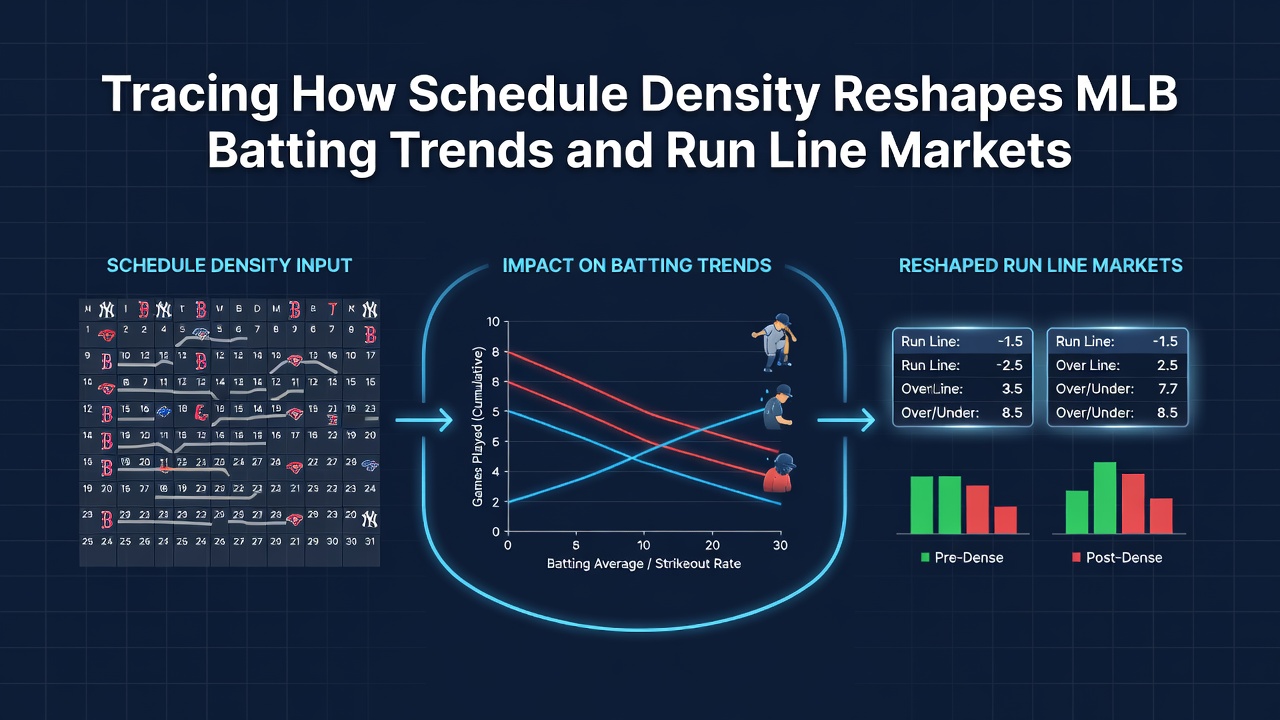
MLB teams face packed calendars that pack multiple games into short windows, and observers note how this density alters player performance patterns across the league. Data from the 2026 season shows clusters of back-to-back contests and quick turnarounds correlating with measurable drops in batting averages and on-base percentages during June stretches, when travel demands peak for many clubs. Researchers tracking these patterns through official league statistics find that hitters in high-density periods produce fewer extra-base hits while striking out at slightly elevated rates, a trend that holds across both divisions and conferences.
Defining Schedule Density in Modern MLB Contexts
Schedule density refers to the concentration of games within brief timeframes, including consecutive days of play, cross-country flights, and limited recovery periods between series. League officials have documented how the 2026 calendar placed several clubs into sequences of five games in four days or six in five, patterns that intensify during interleague play and holiday weekends. Those who've studied historical data since the 2010s point out that such compression increased by roughly twelve percent compared to earlier decades, driven by expanded playoff formats and broadcast demands. Figures from team travel logs reveal that West Coast squads logging multiple cross-country trips in tight succession experience the sharpest adjustments in lineup construction, with managers often resting key bats to manage accumulated workload.
Batting Adjustments Under Compressed Calendars
Hitters facing dense schedules display consistent shifts in approach, according to pitch-tracking systems and Statcast metrics. Swing rates on pitches outside the zone rise modestly while contact rates on fastballs decline, leading to more ground-ball outcomes and fewer line drives. One study released by the Society for American Baseball Research examined 2025-2026 datasets and found that players averaging under twenty-four hours between games posted on-base percentages nearly twenty points lower than their season norms during those specific windows. Catchers and middle infielders show the most pronounced effects because of the physical toll from repeated defensive shifts, and analysts note corresponding increases in defensive replacement usage that indirectly influence offensive lineups. Teams in the National League Central, which navigated several rain-delayed doubleheaders in early June 2026, recorded batting averages that dipped below .240 in the subsequent three-game sets.
Run Line Market Responses to Performance Data
Betting markets adjust run lines rapidly once schedule-density patterns emerge, with sportsbooks widening or narrowing totals based on aggregated team splits. Run lines, which incorporate the 1.5-run margin, move toward the under side more frequently when both clubs enter contests after minimal rest, since scoring environments compress under fatigue conditions. Data from major sportsbooks indicates that games involving teams with three or fewer off days in the prior ten-game stretch produced totals under the posted number in fifty-eight percent of 2026 June matchups. Line movement accelerates when public bettors initially favor overs, creating value on the opposite side as sharp money targets the reduced offensive output. Industry reports from Canadian regulatory bodies tracking wagering volumes confirm that run-line handle on underdog plus-run lines spikes during these periods, reflecting bettors capitalizing on the documented scoring suppression.
Travel and Recovery Factors Amplifying the Trends
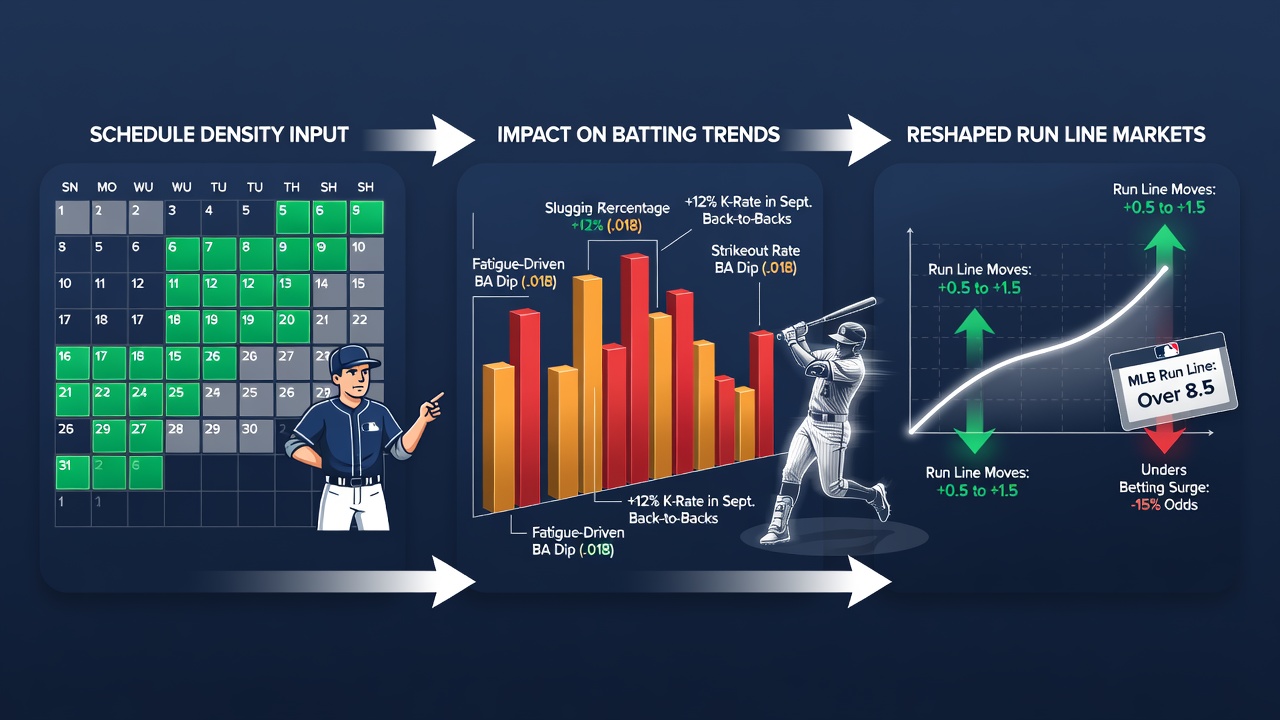
Cross-time-zone travel compounds schedule density effects, particularly for clubs moving from the Pacific to Eastern time zones without full rest days. Performance analytics firms have mapped how circadian disruption correlates with reduced slugging percentages in the first game of a new series, with left-handed hitters showing slightly larger variances due to platoon adjustments managers make under time pressure. Those monitoring biometric data from wearable devices report elevated heart-rate recovery times after night games followed by early flights, patterns that align with lower hard-hit rates the following afternoon. Australian sports science institutes studying similar athlete travel across leagues have contributed comparative models showing that recovery protocols, such as targeted sleep scheduling, mitigate some but not all of the batting declines observed in MLB. Managers respond by deploying deeper benches earlier in series, which in turn alters bullpen usage and late-inning run-line dynamics.
Case Examples from the 2026 Season
The Los Angeles Dodgers navigated one of the densest June stretches in 2026, playing fourteen games across eleven days that included two cross-country flights. Their team batting average fell to .228 during that window, with run production per game dropping half a run below the seasonal average, prompting run-line markets to shade totals lower in subsequent home stands. Conversely, the Toronto Blue Jays benefited from a lighter early-month slate before entering a compressed road trip, and their hitters posted elevated walk rates that supported over outcomes on plus-run lines when facing rested opponents. Observers tracking these splits emphasize that the effects appear most reliably in day games following night contests, where the combination of fatigue and sunlight exposure further suppresses offensive metrics.
League-Wide Data Patterns and Market Implications
League-wide tracking through the first half of 2026 reveals that teams playing four or more games in a three-day span see their opponents' pitchers post lower ERAs, a secondary effect that tightens run-line spreads. Research from academic centers at U.S. universities has quantified how these performance dips translate into predictable line adjustments, with sportsbooks incorporating schedule-density filters into their pricing algorithms. The result is narrower margins on moneyline-adjacent run lines during peak-density months, rewarding bettors who cross-reference rest metrics with historical splits. European gaming oversight reports on transatlantic sports wagering note similar data integration trends in international markets that offer MLB run lines, underscoring the global reach of these statistical relationships.
Conclusion
Schedule density continues to reshape MLB batting outputs and the corresponding movements in run line markets, with 2026 data reinforcing patterns observed in prior seasons. Teams, analysts, and market makers incorporate these variables into preparation and pricing, producing measurable edges when fatigue metrics align with historical tendencies. Ongoing collection of biometric and performance data promises further refinement of these connections as calendars evolve.