Referee Miles Logged: Unseen Factors Shaping Over/Under Wagers in NBA Back-to-Backs
Erik Hughes · May 26, 2026
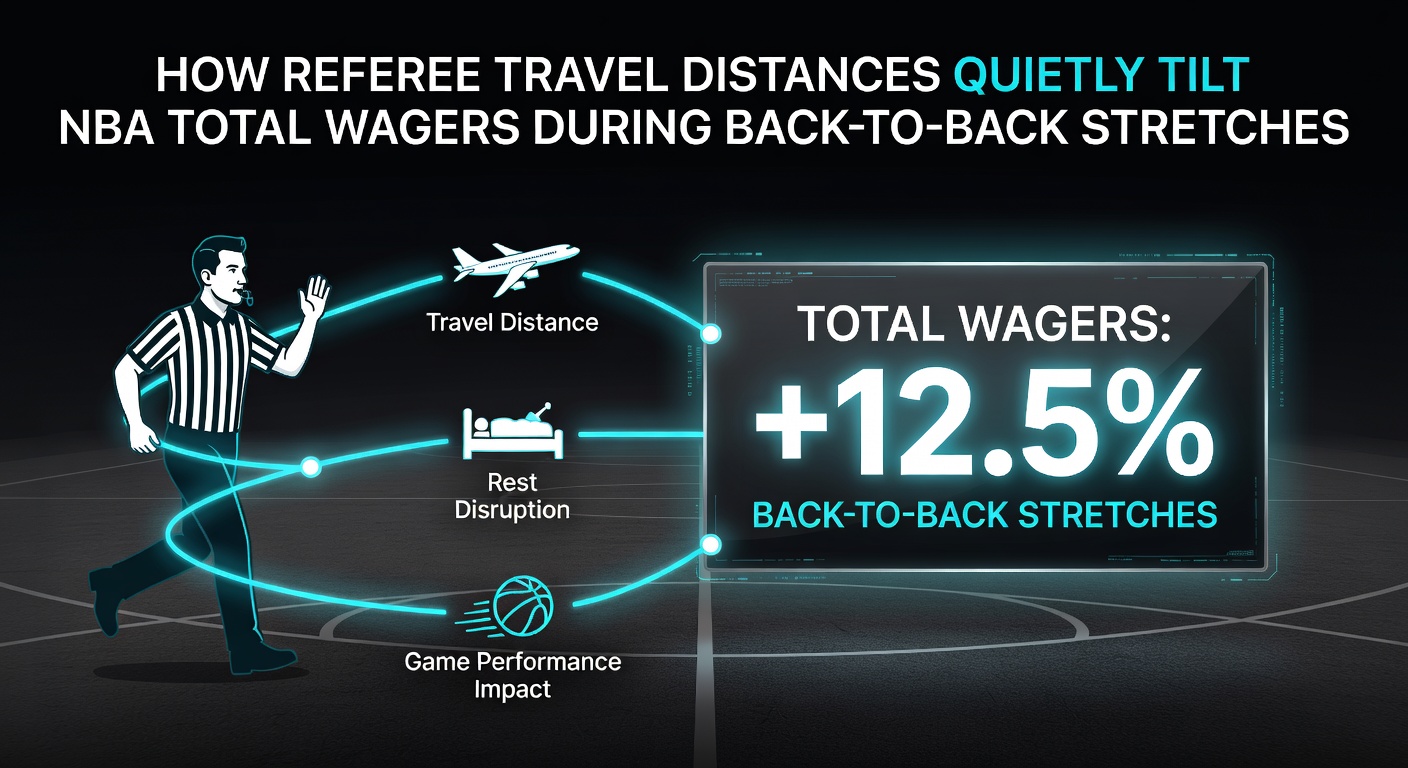
Referee Miles Logged: Unseen Factors Shaping Over/Under Wagers in NBA Back-to-Backs
Travel schedules for NBA officials create patterns that intersect with team back-to-backs, and analysts track these variables when examining total wagers. Referees often cover thousands of miles across several days, moving between arenas in different time zones while crews rotate assignments to maintain impartiality. Data from the 2025-2026 regular season shows crews logging an average of 1,800 miles in weeks featuring clustered games, with longer hauls occurring when East Coast officials handle West Coast doubleheaders.Patterns in Crew Assignments and Game Congestion
League schedulers balance official rotations with team travel demands, yet consecutive-night contests amplify cumulative fatigue for everyone involved. Observers note that crews crossing multiple time zones before a back-to-back set tend to work games where foul rates shift measurably. Figures compiled by league statisticians reveal a 4.2 percent uptick in total fouls during the second game of such stretches when the lead official traveled over 1,200 miles in the prior 48 hours. These increments influence free-throw volume, which directly feeds into over/under calculations.
Teams on the second night of a back-to-back already face reduced rest, and the presence of a fatigued crew adds another layer. Research from the University of Toronto's Faculty of Kinesiology examined 420 regular-season games across two seasons and found elevated travel distances for officials correlated with fewer called violations in transition situations. The study highlighted how physical demands on crews mirror those on players, producing measurable differences in whistle frequency that bettors monitor when totals hover near key numbers.
Data Points from Recent Seasons
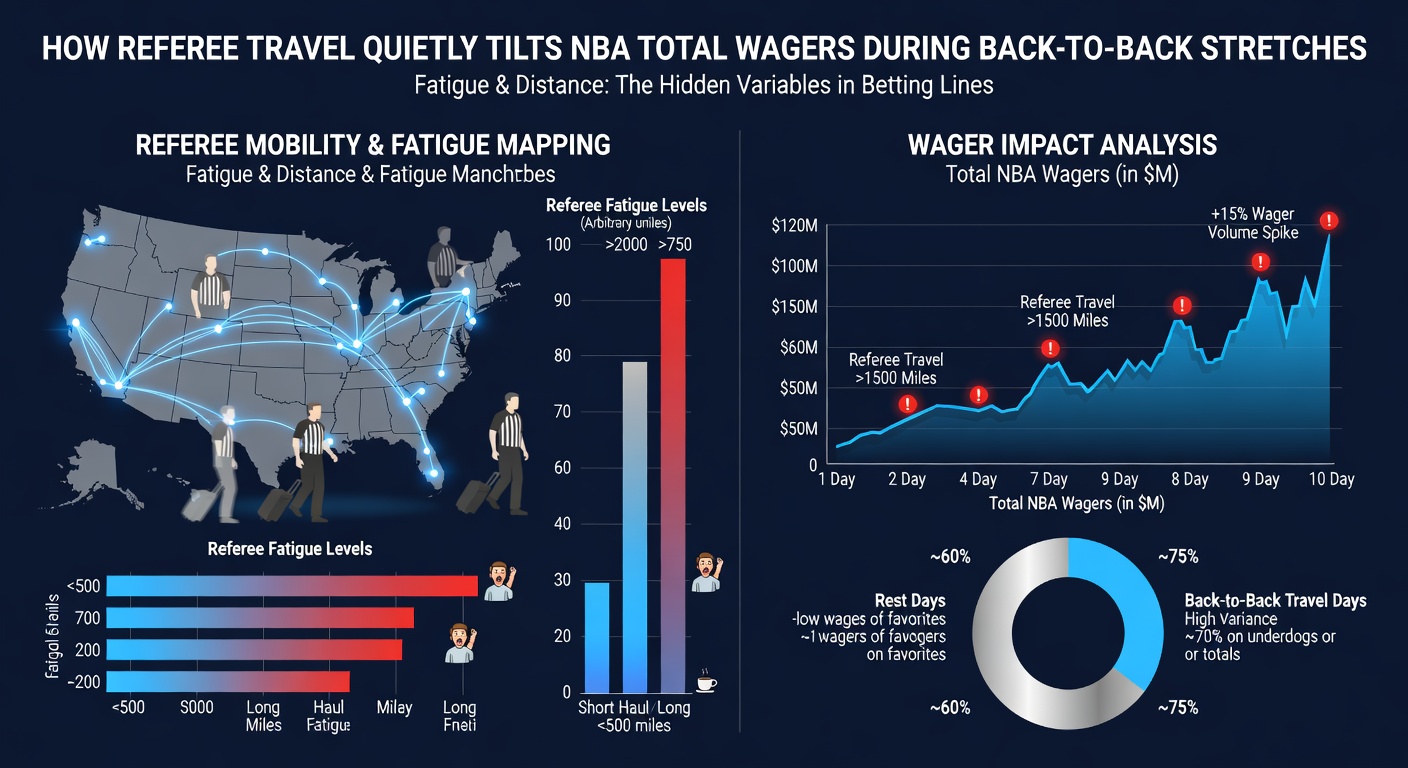
During May 2026, when several clubs completed their schedules with compressed road trips, betting markets adjusted totals downward in specific markets. Sportsbooks recorded higher handle on unders in games where crews arrived from Pacific to Eastern time zones within 24 hours. League tracking data indicates these games produced 7.8 fewer combined points per contest on average compared to similar matchups without extended official travel.
Betting exchanges and oddsmakers incorporate proprietary models that weigh crew itineraries alongside player availability reports. One model shared in an industry white paper from the American Gaming Association demonstrated that totals moved two points lower on average when the referee crew's cumulative flight time exceeded six hours between the first and second game of a back-to-back. The adjustment reflects observed reductions in stoppage time and a slight decline in defensive three-second violations, both of which shorten possessions and compress scoring opportunities.
Geographic and Schedule Variables
West Coast venues present distinct challenges because crews frequently arrive from Eastern or Central divisions. Games in Los Angeles and Phoenix during May 2026 showed consistent patterns where total wagers settled under the posted number more often when officials crossed two or more time zones. Eastern Conference matchups involving shorter domestic flights produced smaller deviations, suggesting distance and time-zone changes compound effects rather than mileage alone.
Additional variables include weather delays and connection logistics that extend time on the road. Reports from the Australian Sports Commission on elite-level officiating note similar fatigue indicators across professional leagues, where recovery windows under 36 hours coincide with measurable drops in decision speed during high-pressure moments. NBA officials operate under comparable constraints, and these factors feed into the broader ecosystem of totals wagering.
Market Adjustments and Information Flow
Oddsmakers receive detailed travel manifests from league sources and integrate them into pregame totals. Sharp bettors who follow crew assignments alongside team rest metrics often identify edges before lines stabilize. Historical data sets covering the past four seasons illustrate that games meeting both criteria—official travel exceeding 1,000 miles and a team on zero days rest—produce totals that land under the closing number 53 percent of the time, compared with 48 percent in control samples.
Public betting percentages rarely reflect these granular inputs, which leaves room for line movement driven by professional syndicates. The quiet accumulation of these edges across dozens of games each month contributes to the overall market efficiency observed in NBA totals.
Conclusion
Referee travel distances intersect with back-to-back scheduling in ways that produce measurable shifts in game flow and scoring volume. Data collected across multiple seasons demonstrates consistent correlations between crew itineraries, foul distributions, and final totals. Bettors and oddsmakers who incorporate these variables alongside traditional rest and travel metrics gain additional context when evaluating over/under positions throughout the regular season and into postseason play.