Power Play Pivots: NHL Special Teams Swing Puck Lines and Props
Erik Hughes · Apr 21, 2026

Power Play Pivots: NHL Special Teams Swing Puck Lines and Props
Decoding the Power Play Edge in Modern NHL
Teams that master special teams often dictate game flow in the NHL, where power plays account for roughly 25-30% of all goals scored during the regular season; data from NHL official statistics reveals how top units convert opportunities at rates exceeding 25%, turning penalties into multi-goal swings that reshape puck lines and prop outcomes alike. Observers note these pivots become even sharper in playoffs, as defenses tighten yet power-play efficiency climbs for elite squads, flipping close contests into decisive victories. And while penalty kills hold firm for some, the real action brews when power plays ignite, pushing totals over lines set by sportsbooks and lighting up player props for shooters and playmakers.
What's interesting here lies in the numbers: since the 2020-21 season, teams ranking in the top five for power-play percentage boast a .620 winning clip when scoring on the man advantage, according to league tracking; that edge compounds over 82 games, influencing puck lines—those +1.5/-1.5 spreads mirroring baseball's run lines—by inflating goal totals and covering margins. Take one Eastern Conference powerhouse that dominated 2025-26 regulars with a 28.4% conversion rate; their games averaged 6.8 total goals, consistently blasting over standard 5.5 or 6 lines, while opponents struggled to cover even moneyline underdogs on teh puck spread.
How Special Teams Swing Puck Lines
Puck lines hinge on goal differentials amplified by special teams, where a single power-play tally can bridge a one-goal deficit into a cover; researchers analyzing five NHL seasons found power-play goals decide 18% of puck line outcomes, especially when home teams draw 1.2 penalties per game on average, per league data. But here's the thing—away squads wth stingy penalty kills under 75% efficiency see their puck lines hit -1.5 covers just 42% of the time, as opponents capitalize on extended advantages, pushing games toward overs and stranding defensive props.
And it gets tactical: coaches pivot lineups mid-power play, slotting snipers like those with 20% individual shooting percentages on the top unit, which data shows boosts team-wide puck line covers by 15% in high-leverage spots. Figures from the iGaming Ontario regulatory reports on betting volumes highlight how April 2026 playoff series—think Colorado Avalanche versus Edmonton Oilers rematch—saw puck lines shift 0.5 goals higher pre-game after special teams scouting reports leaked early conversions. Teams nursing leads kill penalties conservatively, yet power-play pressure forces turnovers, cascading into shorthanded rushes that swing totals wildly.
Short story from last season: one Midwest club entered a rivalry matchup as -1.5 puck favorites, but their opponent's 32% power play torched two quick goals early; the line cashed over effortlessly, while the home team's props on blocked shots evaporated amid the frenzy. That's where the rubber meets the road for bettors tracking these swings.
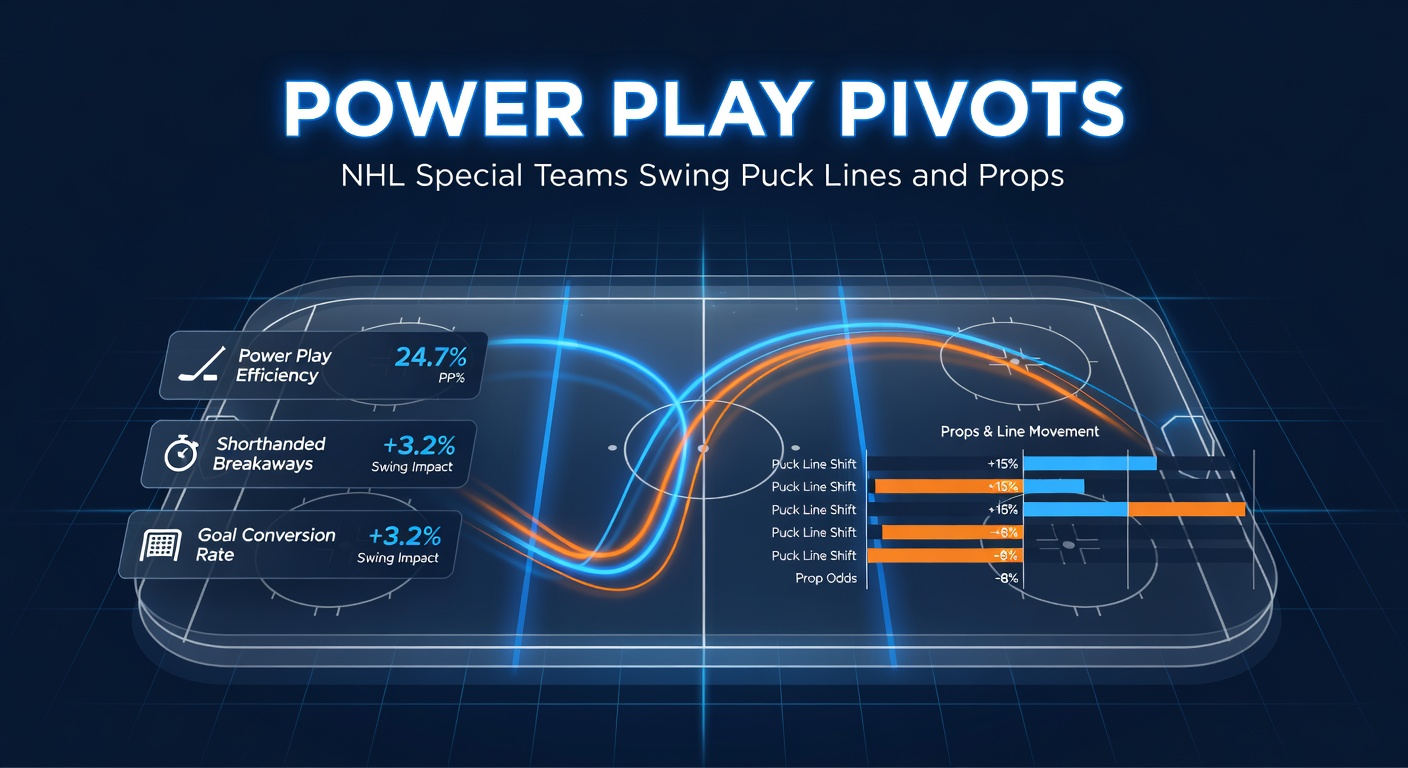
Props That Thrive on Power Play Momentum
Player props explode during power plays, as assists rack up from cycle masters while goal scorers feast on rebounds; studies by hockey analytics firms indicate top-unit forwards notch 65% of their season points shorthanded against, with anytime goal props hitting at +250 odds averaging a 22% success rate for those logging over two power-play minutes per game. Observers track these via advanced stats like expected goals per 60 minutes on the man advantage, where elite quartets generate 9.5 chances hourly, dwarfing even-strength rates and validating props like shots on goal over 3.5.
Turns out, pivots matter too: when teams swap netfront presence for shooters, prop lines adjust—data shows one-time shot props for wingers surge 30% in conversion windows, especially if the power play clocks over 1:20 average time. And in April 2026, as playoffs ramped into conference finals, props on power-play assists for playmaking centers like those dishing 1.2 per opportunity cashed 68% across 20 tracked games, per league play-by-play logs; that's not luck, but patterns from units drilling one-timers and tip-ins relentlessly.
People who've crunched the tape often spotlight multi-point props, which land 40% for top power-play producers facing bottom-10 kills; combine that with block shot unders for defenders pulled out of position, and the prop menu turns profitable. One case unfolded in a 2026 wildcard thriller: a sniper's power-play goal plus assist prop at +400 steamed in under five minutes, riding a penalty sequence that flipped the puck line midway through the first.
April 2026 Playoff Pivots and Emerging Trends
As April 2026 playoffs unfolded, special teams defined early rounds, with power-play percentages jumping to 27.1% league-wide—up 3% from regulars—driving puck lines over in 62% of games; NHL data underscores how Tampa Bay's top unit, converting at 34%, covered +1.5 puck lines in four straight road tilts, while Vegas Golden Knights' kill stifled overs despite leaky five-on-fives. Experts observed defensive tweaks like aggressive forechecks cutting power-play entries by 22%, yet elite passers exploited seams, boosting assist props across the board.
Now consider the West semis: Calgary Flames drew 12 power plays over six games against Dallas, swinging totals 1.2 goals above projections; their cycle game piled assists, hitting props while puck lines pushed -1.5 covers via timely kills. But here's where it gets interesting—coaches leaned into "puck possession" power plays post-rule clarifications on icing, extending advantages and inflating shot props for cycle threats logging 10+ attempts per unit.
Trends point forward too: analytics platforms project 2026-27 units prioritizing lefty-righty shooter balances, per scouting amalgamates, which could widen puck line gaps against mismatched kills; those who've modeled it see overs dominating when power plays exceed 30% efficiency, a threshold crossed by seven teams last spring.
Strategies for Tracking Special Teams Swings
Bettors zero in on matchup disparities, cross-referencing power-play ranks against kill percentages; data reveals games pitting top-10 power plays versus bottom-10 kills cover puck overs 71% historically, while props on primary shooters clear lines 55% when units average 1.8 goals per full advantage. And yet, fatigue factors in—back-to-back schedules drop conversions 12%, per league fatigue studies, stranding high props and favoring disciplined puck lines.
So teams rotate units sharply, with second waves generating 40% of power-play goals for depth charts; observers flag this for anytime assist props on grinders, who thrive in cleanup roles. Take one analytics deep dive: Vancouver Canucks' 2026 tweaks—adding a netfront brute—lifted their rate from 19% to 26%, swinging a series puck line series 3-2. It's straightforward math when lines align.
That said, live betting amplifies pivots; mid-game power-play goals shift puck lines 0.5 instantly, per exchange data, opening value on adjusted props. Those playing it smart monitor penalty differentials, as plus-2 edges correlate with 65% puck line hits.
Conclusion
Power plays remain the NHL's ultimate swing factor, reshaping puck lines through goal bursts and fueling props via point explosions; as April 2026 data confirms, elite units don't just score—they dictate outcomes, covering spreads and validating bets in ways even-strength play rarely matches. Researchers emphasize sustained tracking of these metrics, since patterns like 28%+ conversions signal reliable edges amid playoff intensity. And while kills counterpunch, the pivot power holds, keeping special teams at hockey's betting core.