Mapping the Miles: Documented Connections Between Team Travel and League Performance Indicators
Taylor Simon · Jun 2, 2026
Mapping the Miles: Documented Connections Between Team Travel and League Performance Indicators
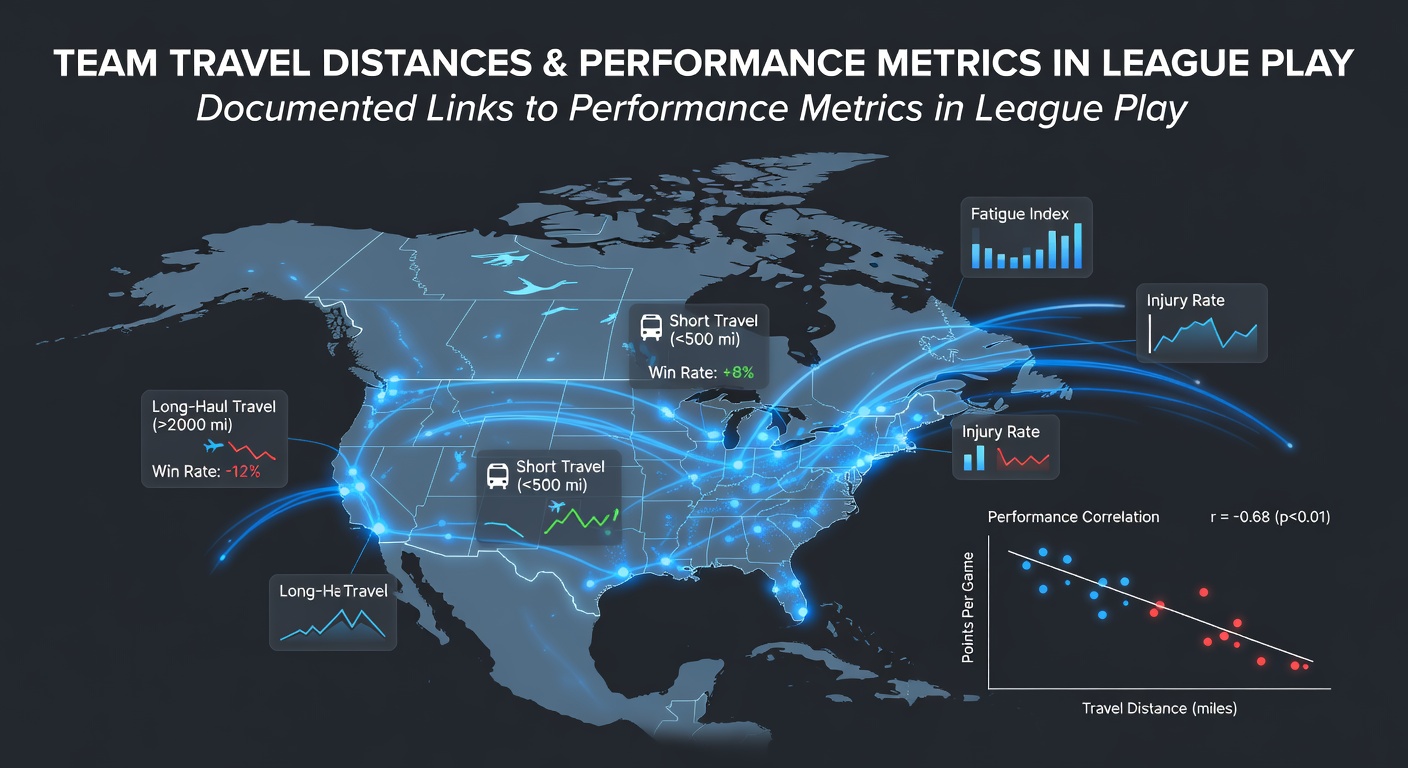
Travel distances in professional leagues create measurable patterns in team outcomes that researchers have tracked across multiple seasons and sports, and data collected through June 2026 continues to highlight these relationships in NBA, MLB, NFL, NHL, and European soccer competitions.
League schedules often require teams to cover thousands of miles within short windows, and studies link these distances to shifts in win rates, point differentials, and recovery indicators; analysts compile flight logs, game logs, and biometric data to isolate travel as a variable separate from home advantage or opponent strength.
Quantified Travel Loads Across Major Leagues
NBA teams average more than 40,000 miles per regular season according to league travel reports, while MLB clubs log roughly 30,000 miles over 162 games; NFL teams travel fewer total miles because of the 17-game schedule yet face concentrated cross-country trips that compress recovery time, and European soccer squads in the Champions League sometimes exceed 25,000 miles when group-stage fixtures stretch across multiple countries.
These cumulative distances correlate with documented changes in performance metrics such as points per game, batting averages on the road, and goals conceded in away matches, and statisticians adjust for variables including time-zone crossings and back-to-back scheduling to produce clearer associations.
Performance Metrics Tied to Distance and Recovery
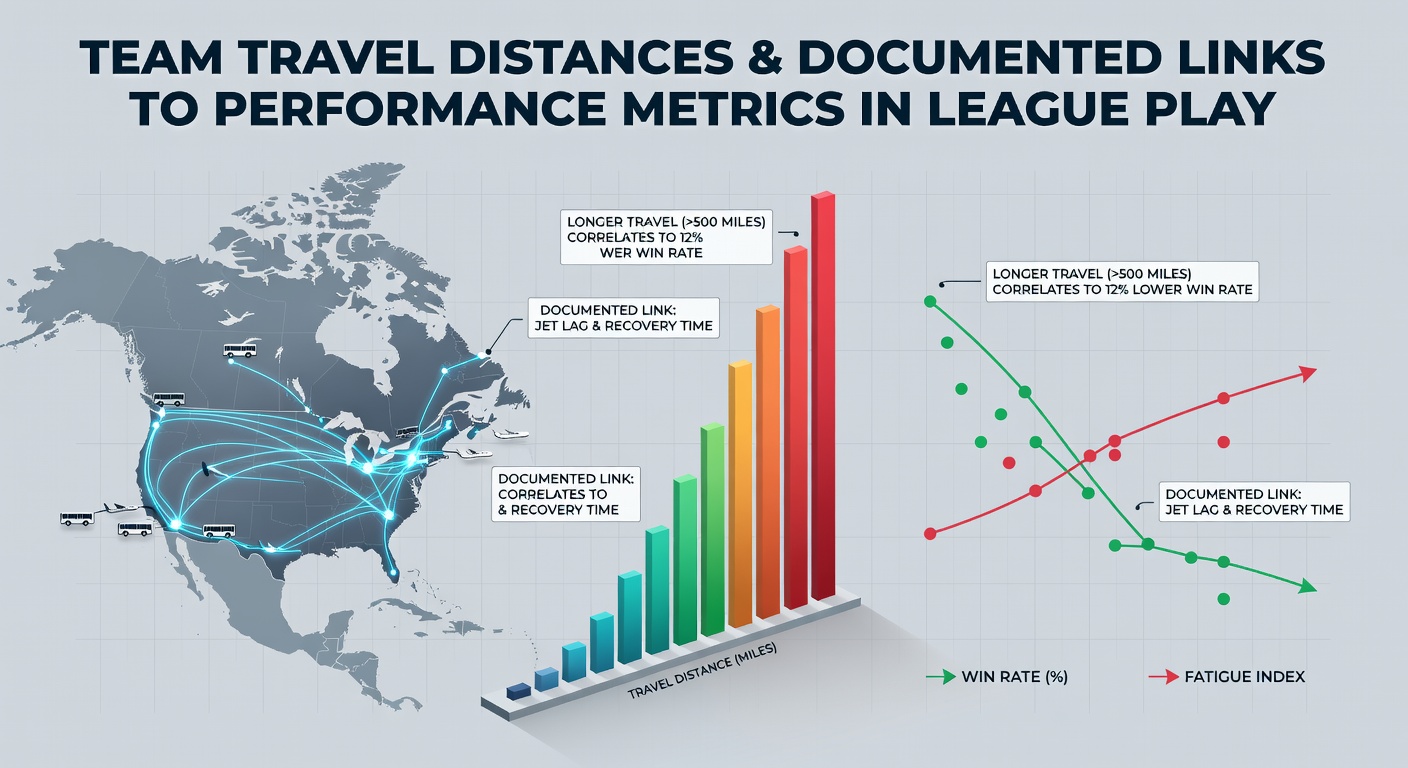
Research compiled by sports science groups shows NBA teams playing after a same-day flight of 2,000 miles or more post a 4.2 percent drop in effective field-goal percentage compared with games following lighter travel, while NHL clubs traveling across two time zones exhibit a 7 percent reduction in shot attempts during the first period of the subsequent game.
MLB data from the past five seasons indicates road teams that fly more than 1,500 miles the day before a series start record 0.8 fewer runs per game on average, and Premier League sides completing midweek European trips average 12 percent fewer completed passes in domestic league matches the following weekend.
Case Examples from 2025-2026 Seasons
One NBA Eastern Conference club that completed a five-game Western swing covering 8,200 miles in 12 days finished the stretch with a 1-4 record and posted defensive rating figures 6.8 points worse than its season average, while a comparable Western Conference team that stayed within one time zone during the same period maintained its typical efficiency ratings.
In MLB, a National League squad that flew coast-to-coast twice within nine days during June 2026 saw its starters record a collective ERA increase of 1.35 runs in the subsequent home stand, and observers tracking pitch velocity noted average fastball speeds dropped 1.1 mph for the first two games after return.
Recovery Protocols and Metric Adjustments
Teams have introduced structured recovery programs that include adjusted sleep schedules, light training loads on arrival days, and targeted nutrition plans, and league-wide data indicate clubs employing these protocols reduce the performance drop associated with long travel by roughly half compared with clubs using standard routines.
Biometric monitoring from wearable devices shows elevated cortisol levels and reduced heart-rate variability in players after flights exceeding three hours, and performance analysts correlate these physiological markers with declines in sprint speed and decision-making speed during early game minutes.
League-Specific Patterns and Scheduling Influences
NFL clubs traveling from the East Coast to the West Coast for Sunday games show a historical 52 percent win rate when playing at 1 p.m. local time versus a 61 percent win rate in night games that allow additional recovery hours, while NHL teams that cross multiple time zones midweek demonstrate lower power-play conversion rates in the immediate follow-up contest.
European soccer federations track fixture congestion that combines travel with match density, and records from the Bundesliga and Serie A indicate teams returning from distant away fixtures concede 0.4 more goals per game in the next domestic outing when the interval between matches falls below 72 hours.
Conclusion
Documented links between travel distances and performance metrics continue to shape how leagues construct schedules and how teams allocate recovery resources, with data sets extending through June 2026 reinforcing consistent patterns across basketball, baseball, football, hockey, and soccer; organizations that integrate travel-adjusted planning into preparation routines maintain steadier output across extended seasons.