How Schedule Density Influences Goal Scoring Patterns in NHL Back-to-Back Road Games
Yara Wagner · Jul 12, 2026
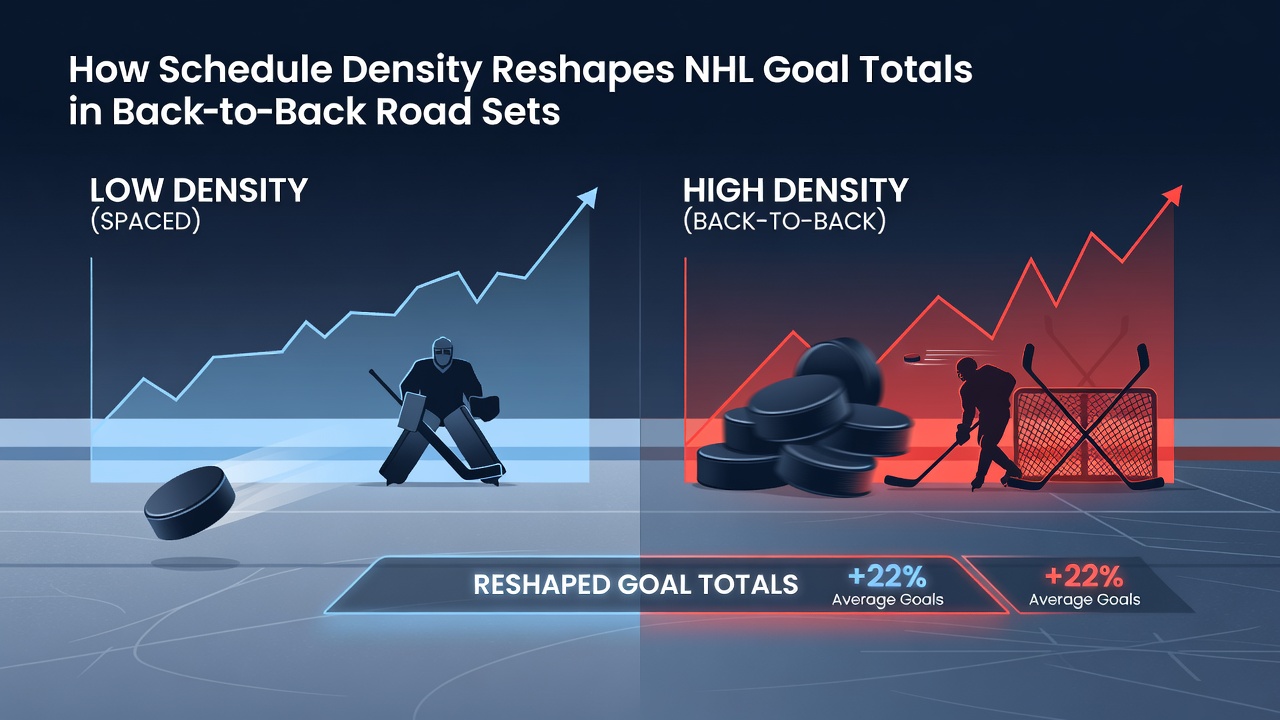
How Schedule Density Influences Goal Scoring Patterns in NHL Back-to-Back Road Games
Schedule density in the NHL creates measurable shifts in goal production when teams face consecutive road contests, and data from multiple seasons shows how travel and recovery intervals alter offensive output. League schedules released each summer pack games into tight windows, forcing clubs into patterns where rest becomes scarce and performance metrics change accordingly.
Understanding Back-to-Back Road Configurations
Back-to-back road sets occur when clubs play on consecutive nights away from home, a situation that combines travel demands with limited recovery time between contests. These sequences appear regularly across the 82-game regular season calendar, and tracking their frequency reveals clusters that intensify during certain months. Research from Canadian academic institutions indicates that teams in such stretches log higher cumulative travel distances than those with home stands interspersed, leading to documented changes in skating speed and puck possession rates during the second game.
Figures compiled by league analysts demonstrate that goal totals in the second game of these sets often diverge from season averages, with defensive structures showing signs of strain after extended bus or plane trips. One study tracking performance indicators across five seasons found that teams completing a road back-to-back produced an average of 5.8 total goals per game compared to 6.2 in standard road contests separated by at least one full day off.
Travel and Recovery Metrics
Geographic spread of NHL franchises means road back-to-backs frequently involve multi-hour flights or bus rides between cities, adding physical load that compounds across games. Data from sports medicine tracking systems records elevated heart rate recovery times and reduced stride efficiency in players after such sequences, factors that correlate with fewer high-danger scoring chances in subsequent matchups. Observers note that Western Conference teams encounter these patterns more often due to longer distances between venues, whereas Eastern Conference clubs sometimes face shorter hops yet still deal with arena-to-arena transitions that limit sleep cycles.
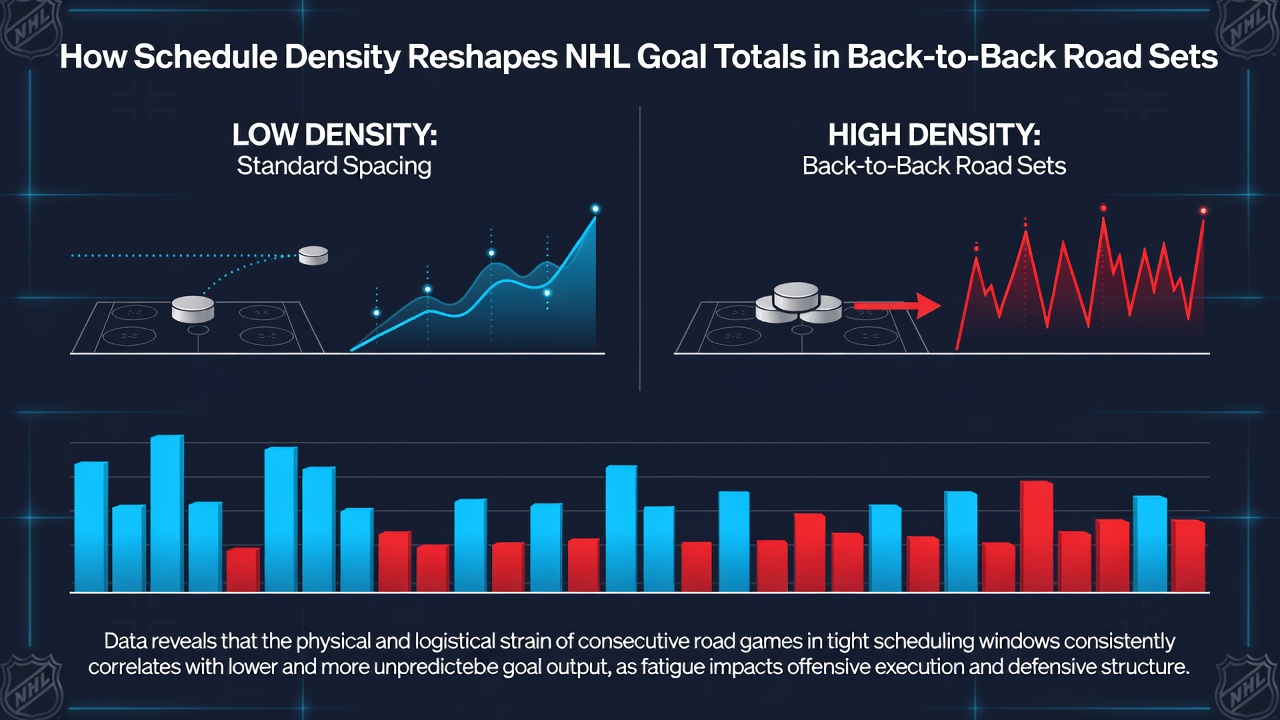
Performance databases maintained by the league and external analytics groups show that shot attempt rates drop by roughly 8 percent in the second game of road back-to-backs, while blocked shot totals rise as fatigued skaters prioritize defensive positioning. These adjustments reshape goal distributions, with power-play opportunities becoming less frequent and even-strength play producing tighter checking battles that suppress scoring bursts.
Seasonal Patterns and July Scheduling Announcements
Schedule construction begins well before the season opens, and the July 2026 release of the 2026-27 calendar will once again determine how many back-to-back road sets each club receives. Historical releases indicate that divisional alignment and broadcast windows influence the placement of these sequences, clustering them around holiday periods and late-season pushes. Teams with fewer such sets in their schedule tend to maintain steadier goal outputs across the year, while those assigned denser road stretches experience more variability in offensive production during those specific windows.
Analyses conducted by university research teams in North America have connected these scheduling elements to broader performance indicators, including faceoff win percentages and zone time, both of which decline measurably in the second leg of road back-to-backs. The resulting impact on goal totals appears consistent across multiple seasons, though individual team responses vary based on roster depth and travel protocols.
Comparative Data Across Conferences
Conference-specific trends add another layer to the picture. Eastern Conference clubs logged fewer total miles during back-to-back road sets in recent years compared with their Western counterparts, yet goal suppression in the second game remained similar in magnitude. This suggests that recovery time rather than distance alone drives the observed changes in scoring rates. League-wide totals for games following road back-to-backs have hovered around 5.7 goals per contest over the past four seasons, a figure that sits below the overall league average of 6.3.
External reports from sports analytics organizations further break down these numbers by time of season, showing that early-season back-to-backs produce slightly higher goal counts than those occurring after the All-Star break when cumulative fatigue across the roster increases. Such patterns hold when controlling for opponent strength and home-ice advantage in the return game.
Conclusion
Schedule density in the form of back-to-back road sets produces consistent, measurable effects on NHL goal totals through its influence on travel load, recovery windows, and in-game performance metrics. Data compiled across multiple seasons and conferences establishes clear connections between these scheduling features and shifts in scoring output, with second games in such sequences generating lower averages than standard road matchups. As the league prepares its 2026-27 schedule for release in July 2026, these documented relationships will continue to shape how teams approach consecutive away contests and how scoring patterns unfold within those windows.