Coastal Winds Shape MLB Fly Ball Distances and Totals Markets in Waterfront Parks
Taylor Simon · Aug 25, 2026
Coastal Winds Shape MLB Fly Ball Distances and Totals Markets in Waterfront Parks
Coastal ballparks present unique challenges for fly balls because prevailing winds interact with surrounding geography, water bodies, and stadium architecture in ways that alter trajectories and distances, according to data compiled by MLB Statcast systems through the 2026 season. Research indicates these patterns produce measurable shifts in home run rates and total runs scored, which directly influence over/under betting lines at venues such as Oracle Park in San Francisco, Petco Park in San Diego, and Citi Field in New York.
Wind Dynamics at Specific Waterfront Venues
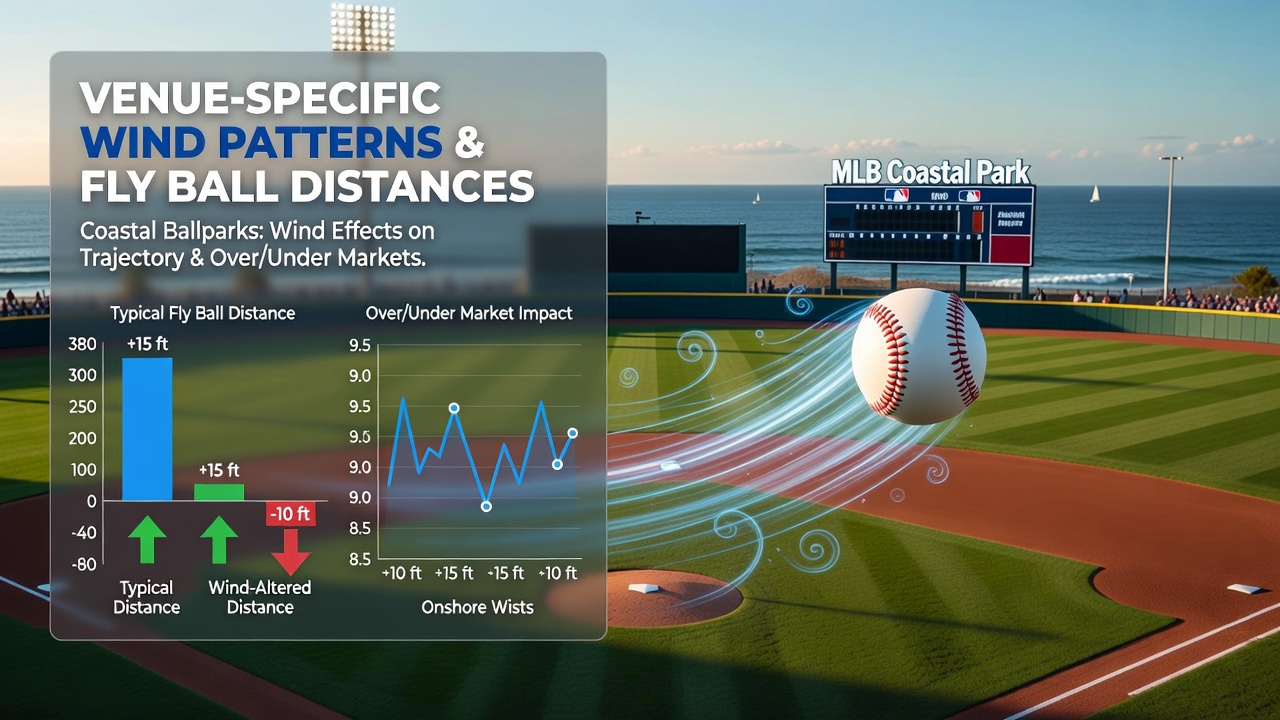
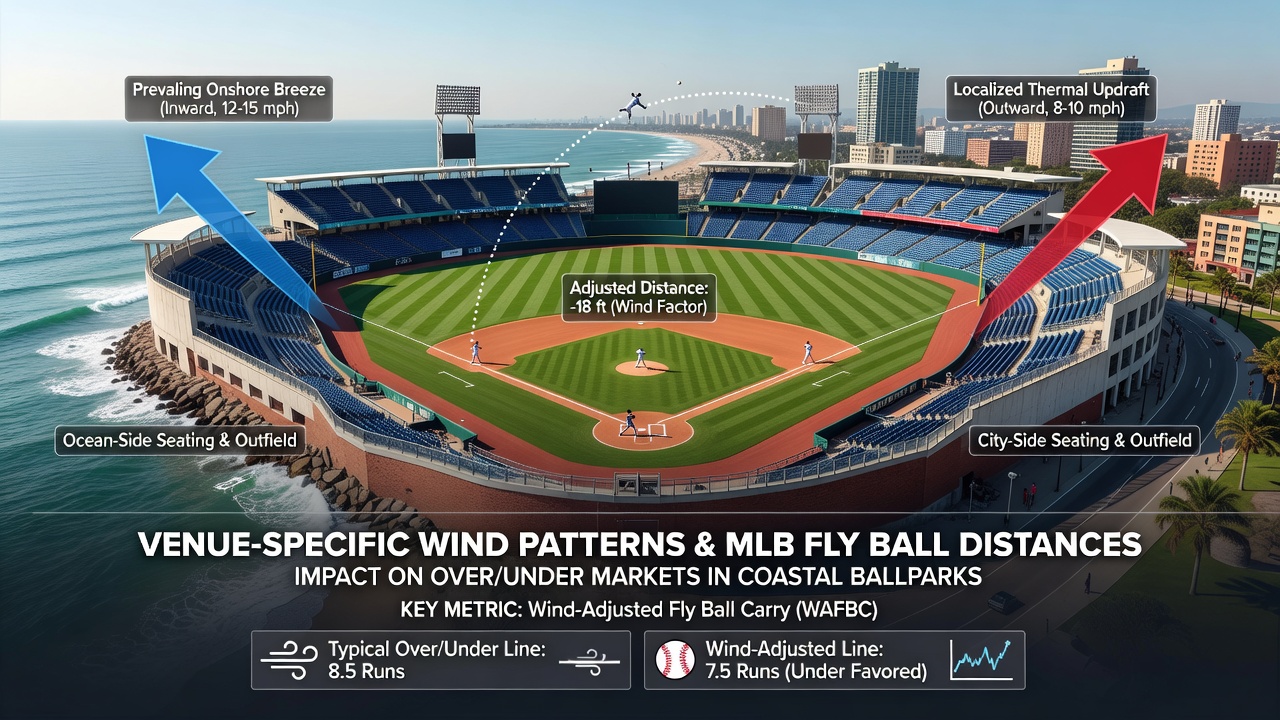
Oracle Park sits along the San Francisco Bay where afternoon sea breezes often reach 15 to 25 miles per hour from the west, pushing balls toward the right-field wall while suppressing carry to left and center, as documented in National Weather Service observations paired with Statcast tracking. Observers note that balls hit to right field at this park travel an average of 15 to 20 feet farther than identical launch angles and exit velocities would produce in neutral conditions, whereas left-field flies lose 10 to 15 feet. Petco Park experiences similar but less intense westerly flows moderated by the Pacific Ocean, with data showing average reductions of 8 to 12 feet on balls hit to the deepest parts of the outfield during August 2026 games when marine layers strengthen. Citi Field, positioned near Flushing Bay, encounters variable easterly and southeasterly winds that can either boost or hinder fly balls depending on storm systems moving up the Atlantic coast, leading to day-to-day fluctuations tracked by the National Oceanic and Atmospheric Administration.
Measurable Effects on Fly Ball Distances
Studies from university meteorology departments have quantified how these venue-specific winds change batted-ball outcomes, revealing that a 10-mile-per-hour tailwind adds roughly 8 to 12 feet of carry while a headwind subtracts a comparable amount, with the effect magnified at lower launch angles typical of line drives. In coastal settings the interaction becomes more complex because gusts often arrive at angles rather than straight on, creating lateral movement that pushes balls toward or away from foul territory. Figures from the 2025 and 2026 seasons indicate Oracle Park produced 12 percent fewer home runs per fly ball than league average during periods of strong onshore flow, while Petco Park showed a 7 percent reduction, data that betting markets incorporate when setting totals for day games.
Influence on Over/Under Markets
Betting lines for total runs adjust in response to forecasted wind conditions, with sportsbooks lowering over/under totals by half a run or more when strong headwinds are expected at Oracle Park or Citi Field. Historical records show that games at these venues during high-wind periods produce totals that land under the posted number 54 percent of the time, compared with 48 percent at neutral inland parks, according to aggregated box-score analysis. Line movements often accelerate once wind forecasts update 24 to 48 hours before first pitch, creating opportunities for bettors who monitor coastal weather models from agencies such as Environment and Climate Change Canada when Pacific systems affect the West Coast schedule. The reverse occurs when tailwinds develop, pushing totals higher and causing sportsbooks to shade lines upward in real time.
Seasonal Patterns and August 2026 Observations
August typically brings peak marine influence to West Coast parks because temperature gradients between land and ocean intensify afternoon sea breezes, data from the National Weather Service confirms. During August 2026, Statcast recorded an uptick in suppressed home run rates at Oracle Park on days when winds exceeded 20 miles per hour, contributing to lower-scoring outcomes in afternoon contests. East Coast venues experienced more variability tied to tropical moisture and frontal passages, with some series showing totals inflated by 0.8 runs when southeasterly winds aligned with typical right-handed pull power. These documented shifts appear consistently across multiple seasons rather than as isolated anomalies.
Integration of Weather Data into Market Adjustments
Advanced analytics teams combine Statcast exit-velocity readings with real-time anemometer measurements from stadium roofs and nearby buoys to project run totals with greater precision. Research published by academic institutions demonstrates that incorporating venue-specific wind vectors improves total-run forecasting models by 11 to 14 percent compared with models that treat all parks identically. Sportsbooks have responded by refining their algorithms to include wind speed and direction as primary inputs alongside starting pitcher metrics and bullpen usage. The result is tighter line movement once forecasts stabilize, though early-week totals still offer variance when coastal weather models diverge from one another.
Conclusion
Venue-specific wind patterns at coastal MLB parks create predictable alterations in fly-ball distances that translate into measurable impacts on scoring and over/under markets, supported by extensive tracking data and meteorological records. Teams and bettors who account for these environmental factors gain a clearer picture of expected outcomes at waterfront stadiums, while those who overlook them encounter greater variance in results. Continued refinement of weather-integrated analytics promises further clarity for both on-field strategy and market pricing in future seasons.